This is the third in a series of posts on simplifying FRx.
Once upon a time many years ago, I was helping a large publicly held client with some FRx reports. One of their reports had an incredibly long row format (thousands of rows), and it took FOREVER to run. Upon closer examination, I found that they were using the row format to code lots of accounts for every department. It was like having the entire chart of accounts in there. There was LOTS of room for human error, and heaven help you if you needed to add a department. It wasn’t wrong, but it sure needed some help. In today’s post I’m going to share a technique I used to shorten their row format to about 25 rows total. And performance—you just wouldn’t believe how much faster it was!
So this post is all about departmental reporting, showing a P&L by department (which should be one of the segments or dimensions in the account structure). As you probably know, in FRx you add a departmental tree and come up with a separate report for each unit in the tree.
But what if you want to see every department on the same page? You might be looking for summary information as shown below:
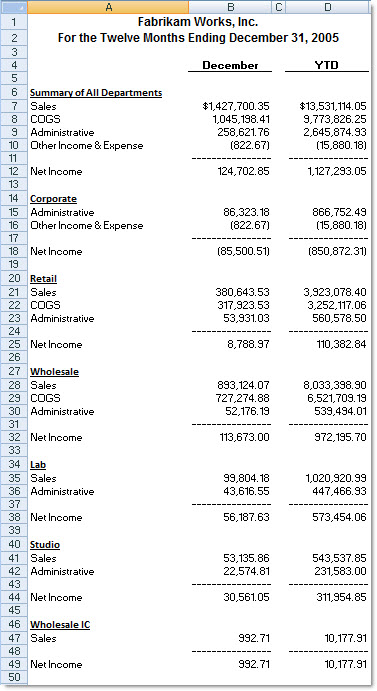
So—you MIGHT be thinking that the following row format is how you would go about coding this report. And you wouldn’t exactly be wrong because it does give accurate results. BTW, this is just a portion; it does have many more rows (not shown here) in order to include every department. And this is the approach that my client mentioned above had taken. But this is not the best design for this job:
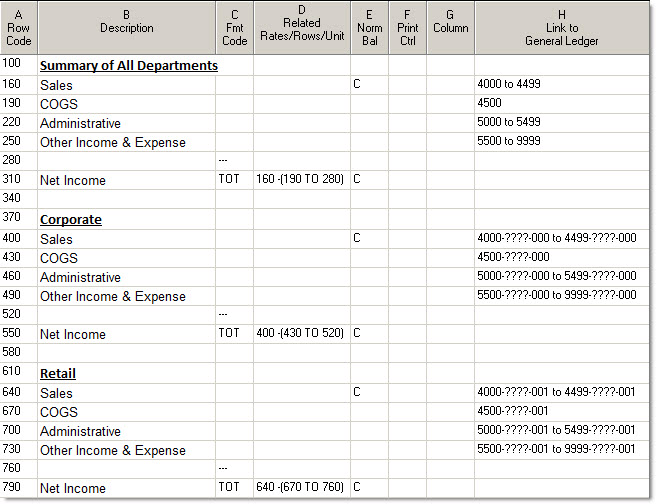
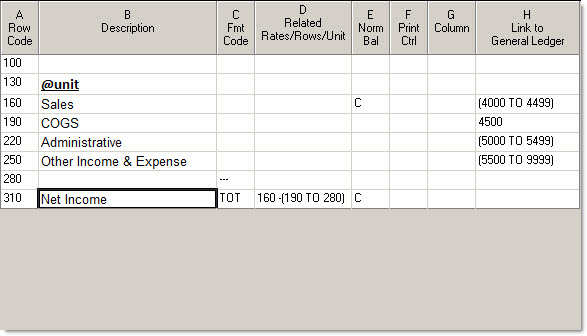
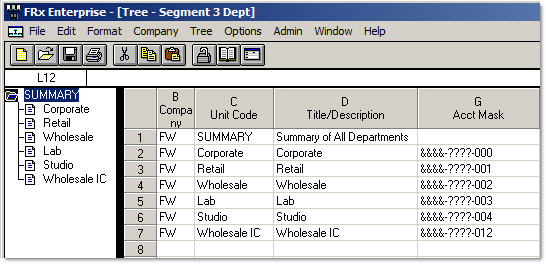
There is a much faster, easier, simpler way to create the above report. Use the following row format with the tree shown below with some specific catalog settings, and you’re good to go. It’s a total of 8 rows! See how much simpler this makes life with FRx?
BTW, the @unit code above pulls the Title/Description from column D of the tree.
Use this new streamlined row format with this departmental tree:
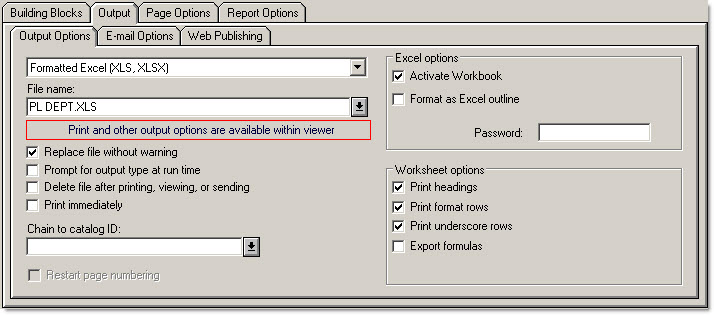
There’s just one thing about this FRx report, though—when you generate the report, it doesn’t show up all on one page in the drilldown viewer. So you either have to print it or export it to Excel to see it on one page. I think it’s a small price to pay. I usually set the catalog to export to Formatted Excel instead of exporting from the drilldown viewer. This just saves several clicks. Oh and be sure to check Activate Workbook too:
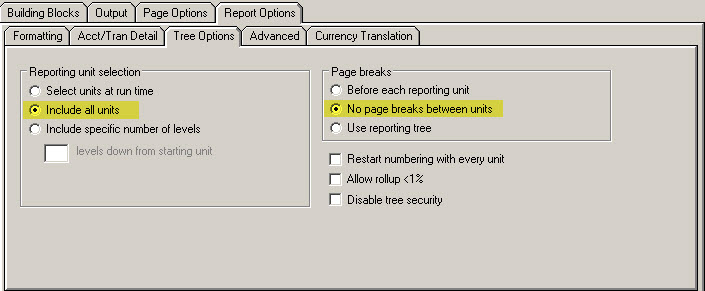
Finally, two more catalog settings and you’re done:
‘Include all units’ is optional but advised—it just runs the report for every unit in the tree without your having to Mark All.
‘No page breaks between units’ is essential. It’s what puts each department on the same page.
So there you have it—a summary report with departments on the same page. Another benefit to this report design is that maintenance is greatly simplified. When you add a department, all you have to do it add it to the tree! SWEET.
Can I just say I love you for this!! I wish I had known about this a long time ago! My one question for you though – If we wanted to do a report similar to this but by product line and each product line contains 5 or 6 departments, is there a simple way to get each product line’s summary at the top of the page rather than having it go in the order of the tree? Not sure if that makes sense.. but it would be pretty nifty!
You are too funny!
It would be a totally different design from this, but you can always restrict a row to product line using column D in the row format. Drop it down and choose the product line rollup from the tree. It’s not nearly as automated as the above design and you have to be very careful with accuracy to boot, making sure that your bottom line ties out to something. Good luck!
Hi Jan,
Quick question…Since it appears Management Reporter has not option for ‘No page break between units’, how are you overcoming this in producing Management Reporter summary reports? Thanks!
Ugh I have really missed the no page break between units option. It’s easy if you just want one line for each department—just list the department dimension in the row and filter the columns with the P&L main accounts. Not so easy if you want more than one line for each department. Then you have to combine the department dimension with the main account dimension on each row…and it can be a bear to maintain depending on how many departments there are.
Hi Jan!
Thanks for answering my last question. I’ve bought your two FRX guides and they are wonderful!
I would like to build a report like this but my client has different department codes that are really the same department. I.e. Dept code 1000 and 1100 should really be just one department. Is there a way to merge them together on the tree so they both show on one report? I’m thinking the solution is your “Joe and Janie” example in your intermediate manual – but I don’t want the sub-reports to print or display, just the “rolled-up” version. Do you have any ideas? Thanks a bunch!
Hey many thanks for the compliments on the FRx guides, Jeanne!
You are absolutely correct that one solution is the ‘Joe and Janie’ example. (Rollups of 2 units.) You can nonprint the units that you don’t want to print, but then that impacts drilldown capability. If you can figure out a way to wildcard the 2 departments, then that would be the best way, but it’s often not possible. For instance, if there aren’t any other departments that start with 1, then you could wildcard it in the tree as 1??? and be good to go. And have drilldown capability. Good luck, and thanks for the purchase :) Jan
Hi Jan,
I’m a return FRx user. Last time I used it was in 2001. I just started at a midsize seminconductor company, with many subsidiaries, that uses FRx. Each subsidiary is a separate company in Microsoft Dynamics AX, our accounting system. Can I use the FRx Tree / Department reporting capabilities to report on these companies (e.g. a columnar B/S or P&L report by company)? Currently, FRx has been set up to do company reporting based on currency, not actual company in the accounting system. Unfortunately there are differences between the two. Any help at all is appreciated.
Dave
Hi Dave…well, welcome back to FRx. You’ve hit it just in time for it to be shelved and replaced! Meanwhile, take a look at the sample pages from my FRx Intermediate training manual. The sample pages show a columnar P&L with departments side by side. You can use almost the same technique with reporting units instead of account filters. Any time you have multiple companies in the accounting system, you’ll need a tree if you want to pull data from more than one company. So create the tree, and use the Reporting Unit cell in the column to restrict the company. It’s your lucky day that the sample pages I used just happen to be on a columnar P&L :) Good luck…Jan
Wow Jan, thank you for the fast and helpful response! I’m looking forward to digging in and trying this. I’m sorry to see FRx go. Down the line (1-2 years?) we’ll be upgrading to AX 2012. I guess we’ll be looking at other alternatives for reporting, at that time, given FRx’s retirement. I’ll be interested to learn more. Thanks so much again. ~Dave
Hi Dave,
I want to print all the Departments that I have listed in a tree, regardless if there was any activity or not. I am creating Budget comparison reports (7 months actual / 5 months Previous Year on one report and (7 months previous year / 5 months Prior Year Budget on a separate report). It’s possible that a new Department was added in the current year and therefore does not exist in the Prior Year report but since it is included in the tree, I want it to appear on that report with all zeros. Possible?
Hi Bill…the option to ‘Display reports with no active rows’ should get you what you want. In FRx, it’s in the catalog under the Report Options tab, Formatting tab. In MR, it’s on the Settings tab in the Report Definition. Hope this helps…Jan