Looking for Subtotals in MR? Me too. While we’re waiting, here’s how to create a pivot in Excel that’s a lot more work, but a half decent substitute.
Here’s a visual on what Subtotals give you
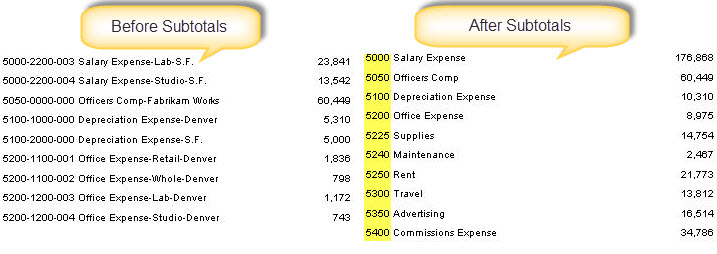
Currently when you drill down in Management Reporter, you get a list showing the full account structure. Just like what’s shown on the left.
Subtotals functionality will give you the option to see, in a couple of clicks, what’s shown on the right. Want to ask Microsoft to add this? Please vote here.
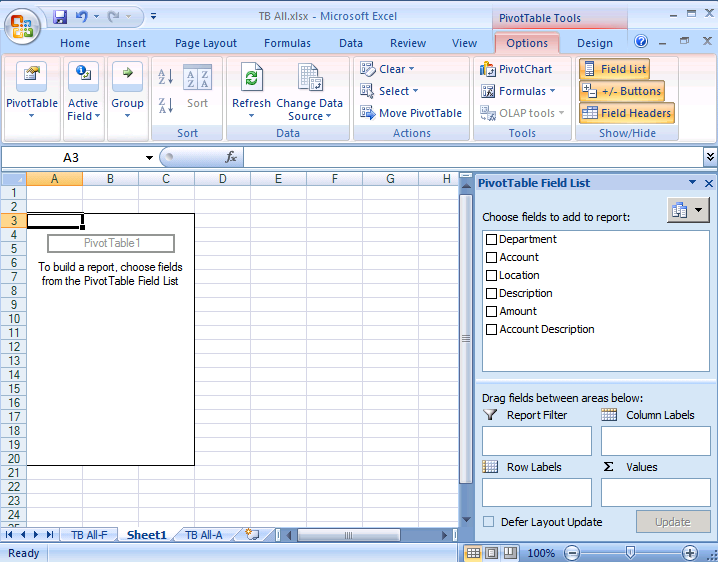
Meanwhile, I’ll show you how to create an Excel pivot table that looks like this

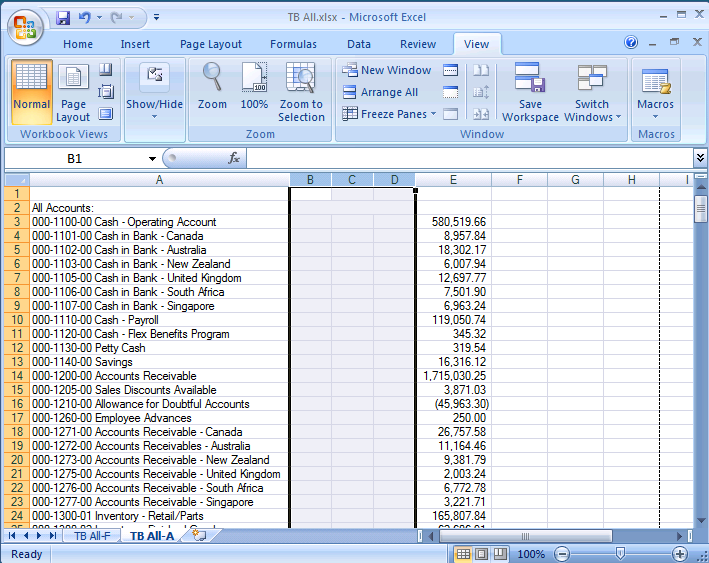
Using data from a Management Reporter report.
This is the Management Reporter row for this report
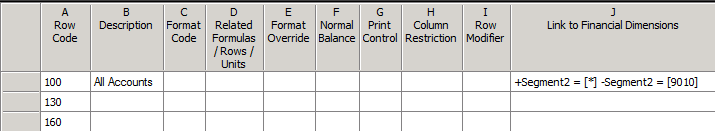
I’ve used a wildcard to pull all accounts, but I’ve backed out 9010 which is the account for square footage. Nothing quite like square footage to screw up a trial balance. Segment2 is the natural account in this database.
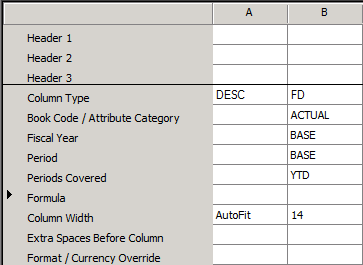
This is the Management Reporter column for this report
Settings to change in the report definition
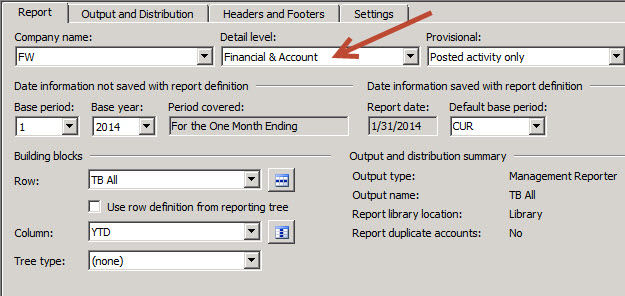
Be sure to set the detail level to Financial & Account.
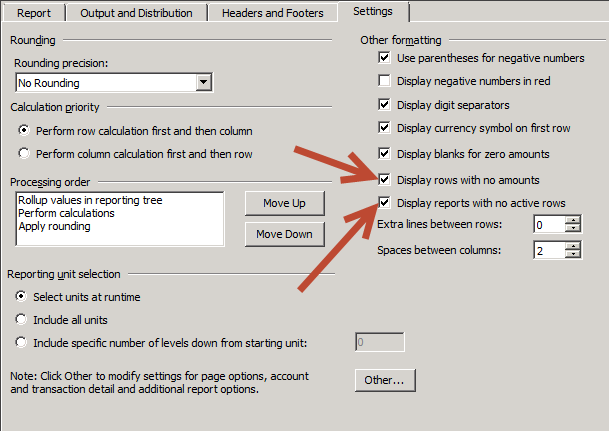
Make sure you mark these two.
Generate and Download to Excel
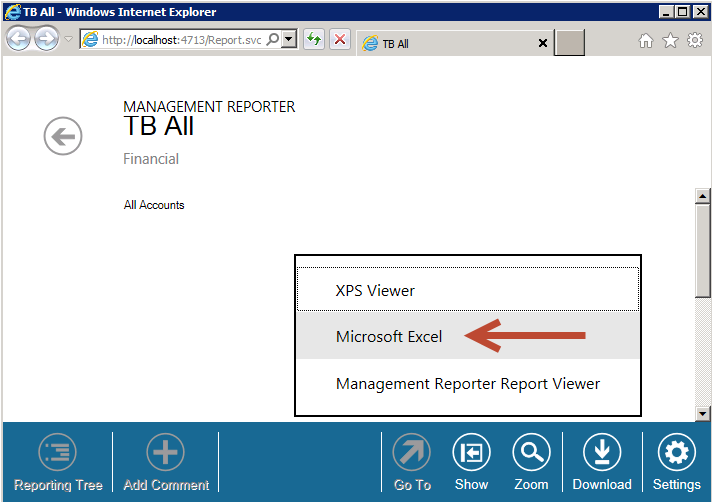
I’m on the latest rollup, RU5, so the report automatically opens in the Web Viewer. Download to Excel.
Results in Excel
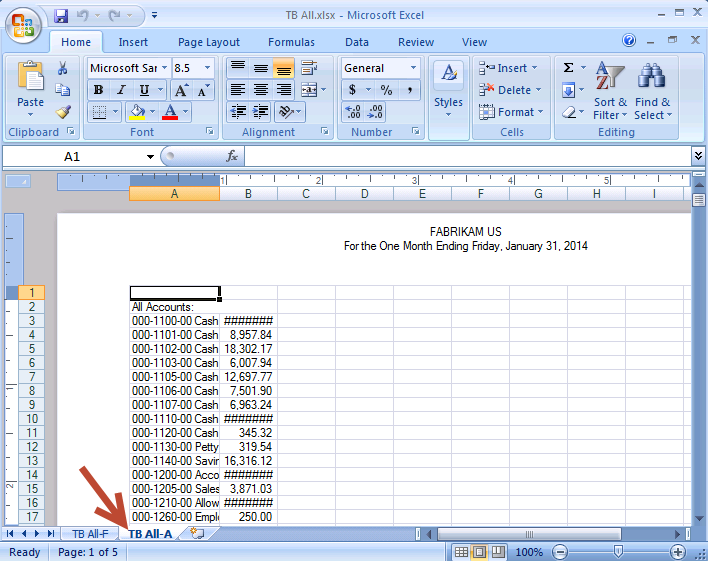
If you don’t have an ‘-A’ tab (that stands for Account by the way), it means your detail level wasn’t set to Financial & Account.
BTW, I’m using Excel 2007 today.
Use the View tab to set the Normal view
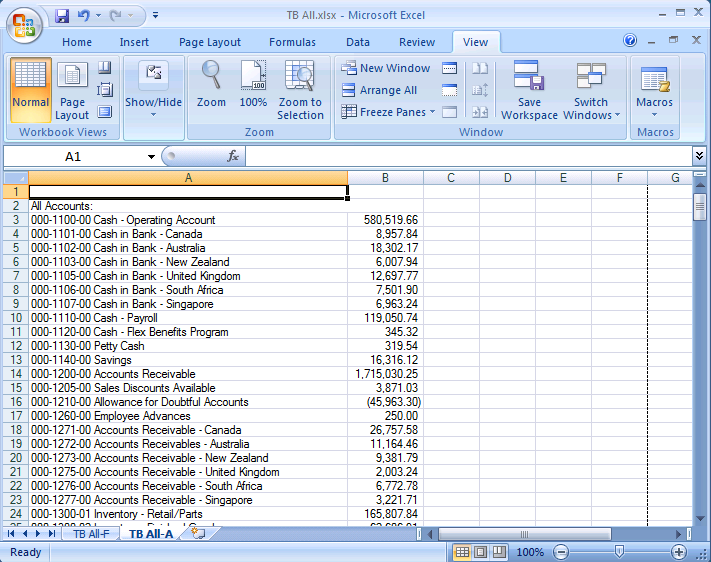
And space the columns so you can actually see them.
Add 3 blank columns
…to prepare for the next step.
Parse the Data
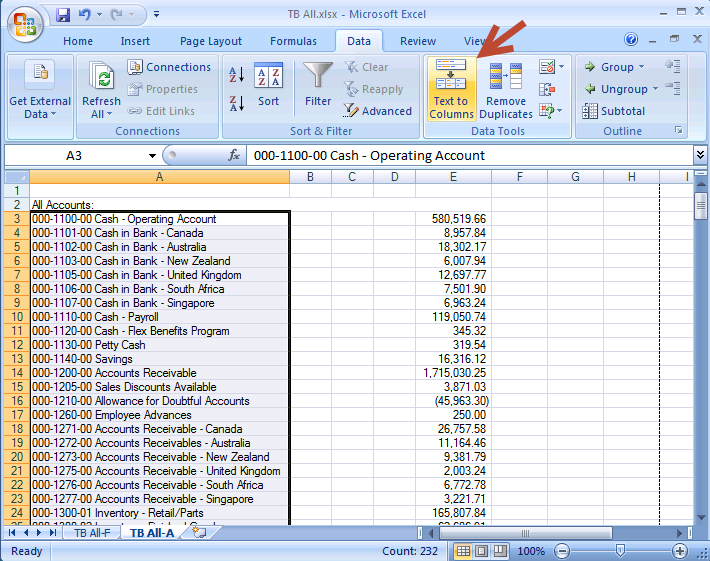
I’m going to use Data>Text to Columns to put each segment of the account structure in a separate column. Highlight the data. Click Text to Columns.
Switch to Fixed Width
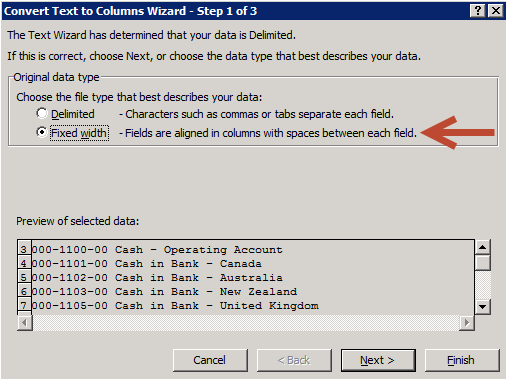
Aside to AX users—I’ve had lots of trouble trying to parse using Fixed Width because of varying dimension lengths. And your Main Account is in the middle of the string because it’s sorted alphabetically for crying out loud. You’ll probably have to experiment with Delimited instead.
Use the mouse to create break lines
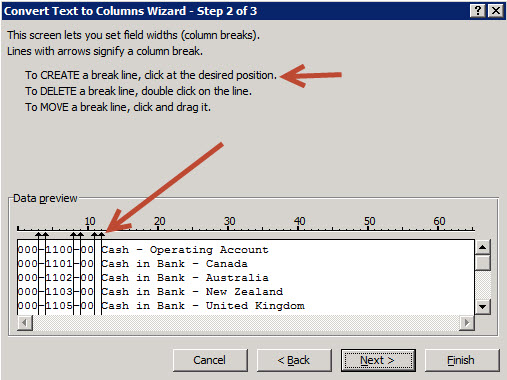
Here I’ve created 6 lines that will break everything into separate segments. Sort of like the scores in a Hershey bar.
Tell the wizard to skip the 3 unwanted columns
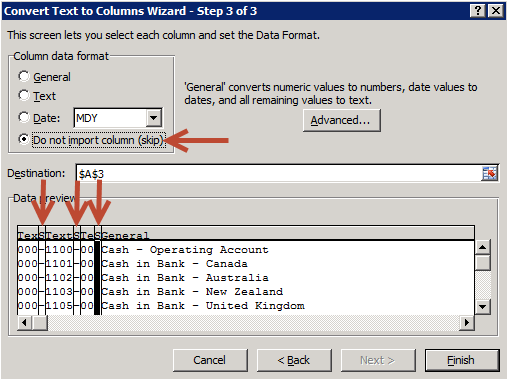
Set the hyphen and the blank columns to Do not import column (skip).
Set the columns with the accounts to text
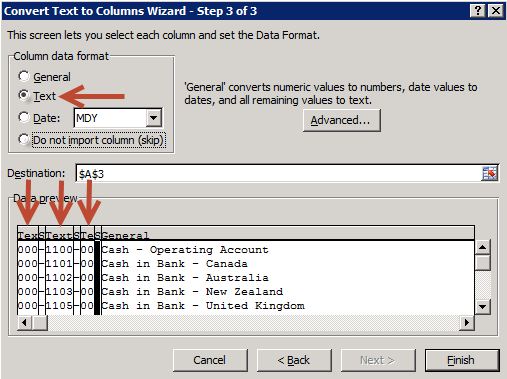
If you set it to text here, Excel won’t think it’s a number and try to foot it or count it.
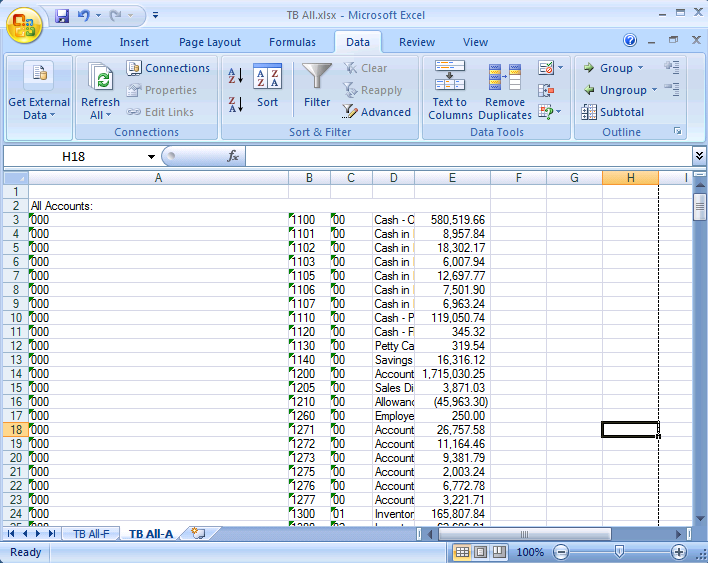
Results after Text to Columns
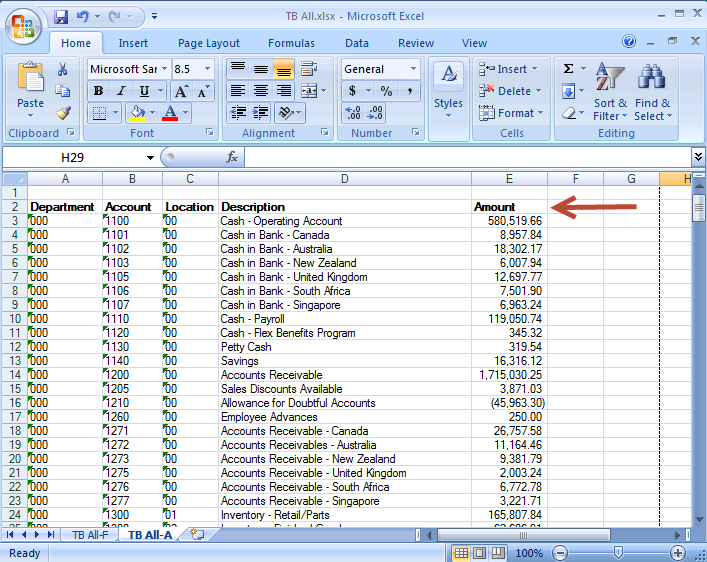
Add column headers
Add another column that marries the Account number with its Description
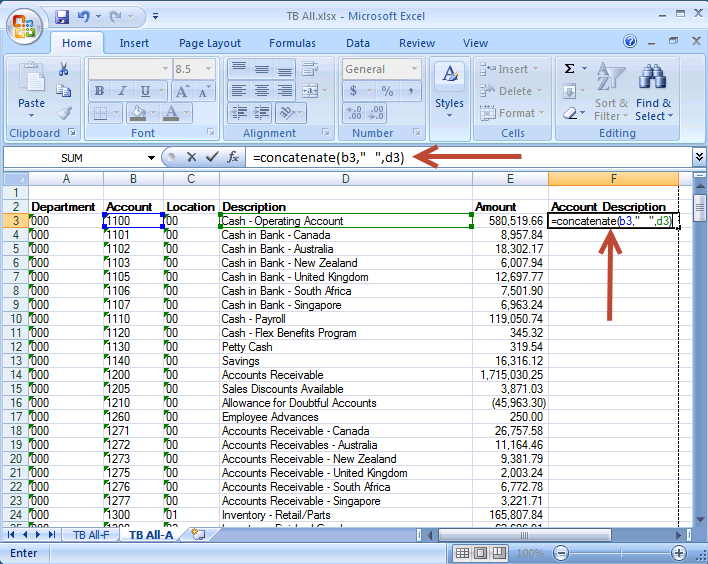
Do that with the concatenate function. Use it to combine the Account in cell B3 with its description in D3. Add 3 spaces in between in double quotes.
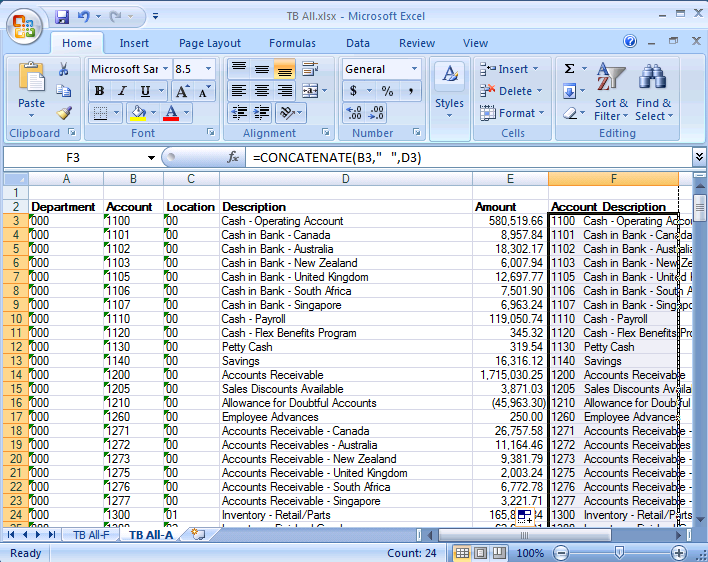
Copy that function all the way to the bottom
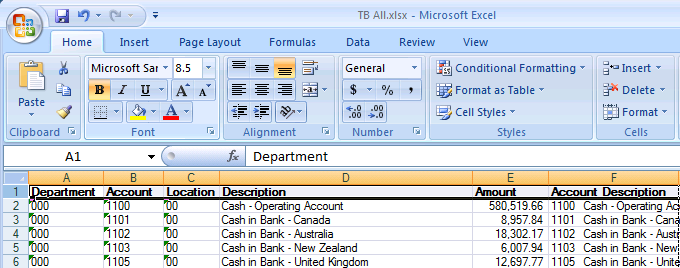
Delete the blank row or rows at the top
Click anywhere in the data and Format as Table
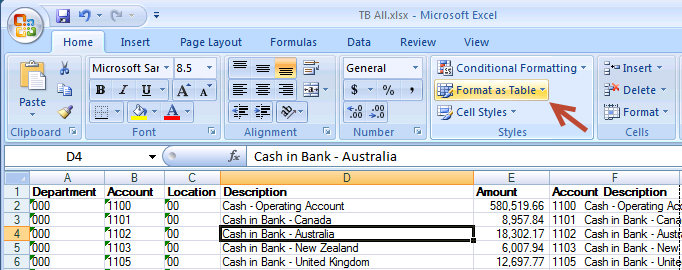
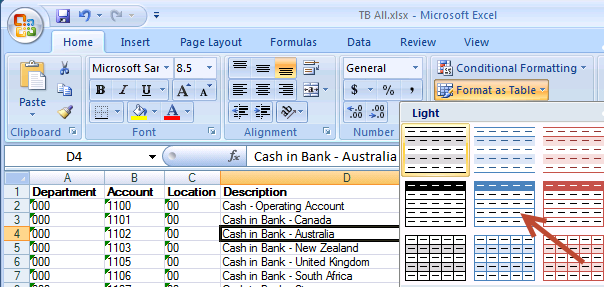
I picked Light 9. Be sure to check the My Table Has Headers checkbox.
Results of Format as Table
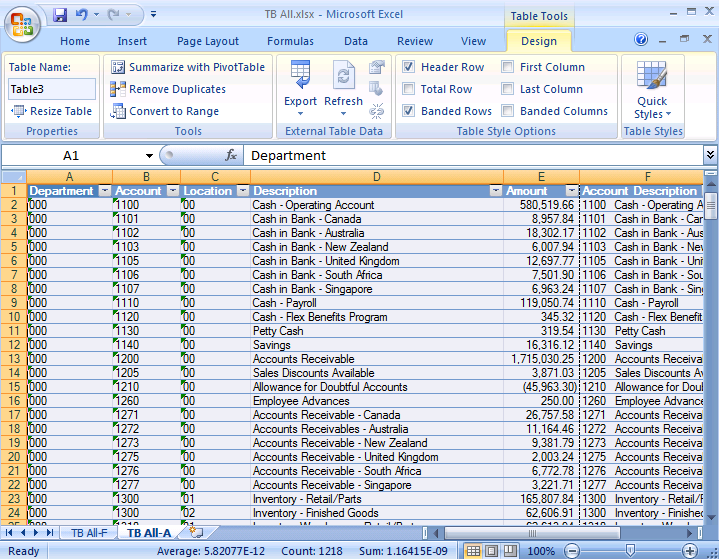
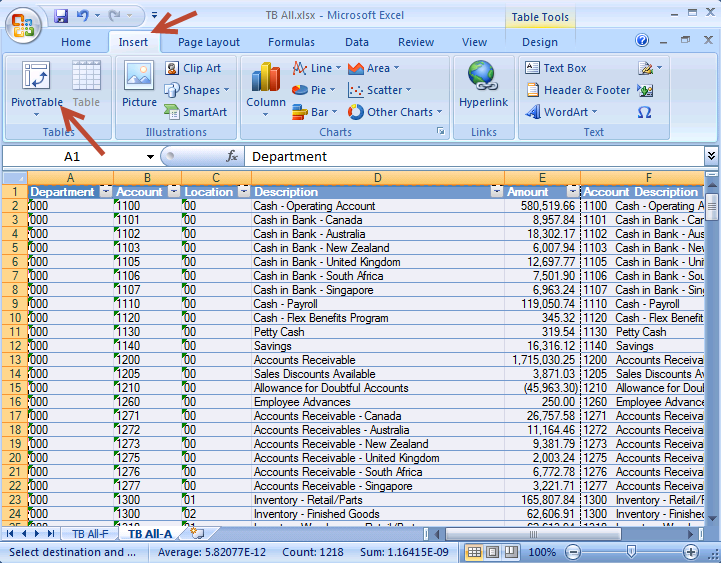
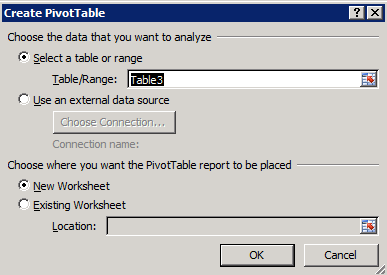
Insert PivotTable
Let this default
Results
Don’t freak out. This is easy.
Don’t drag anything anywhere. Just check 2 boxes.
I know this looks dreadful. But not for long.
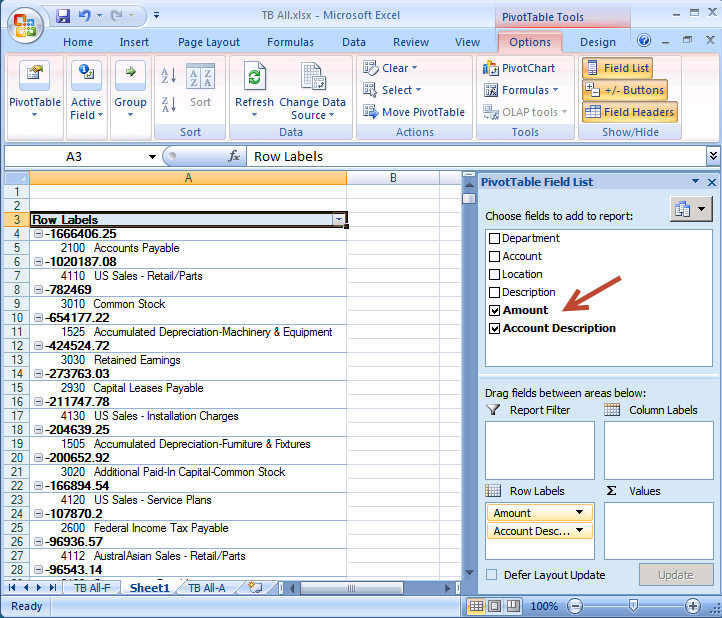
At the bottom right, drag the Amount tile over to the Values section
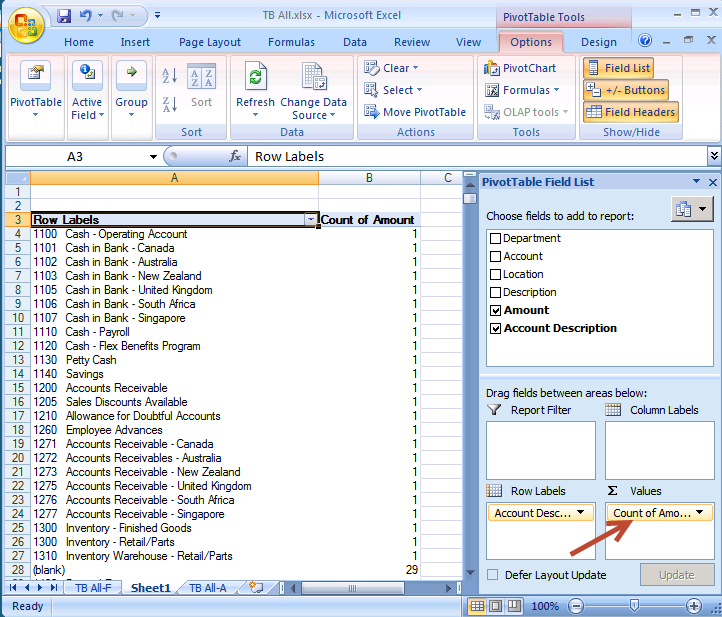
I know—it shows the count and not the amount. I’ll fix that next.
Use Value Field Settings
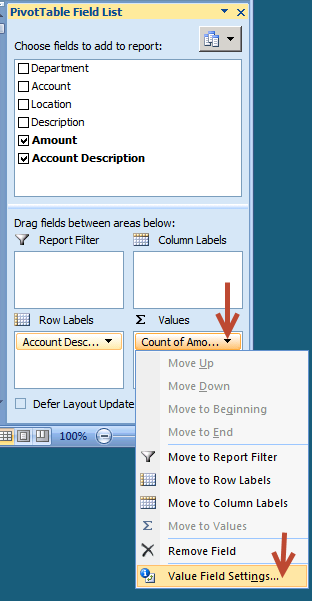
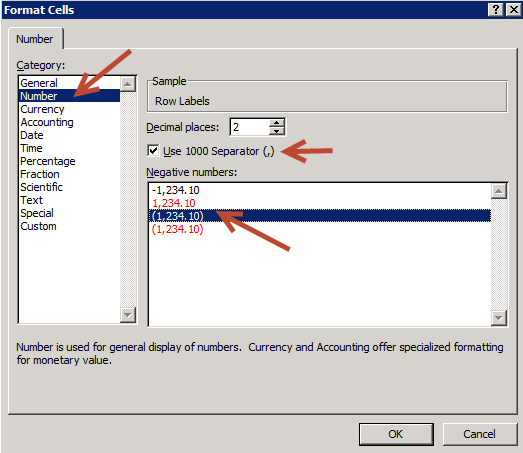
Select Sum, then the Number Format button
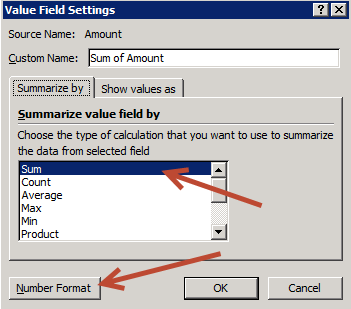
Make these 3 changes using the Number Format button
Results—Account list in a pivot
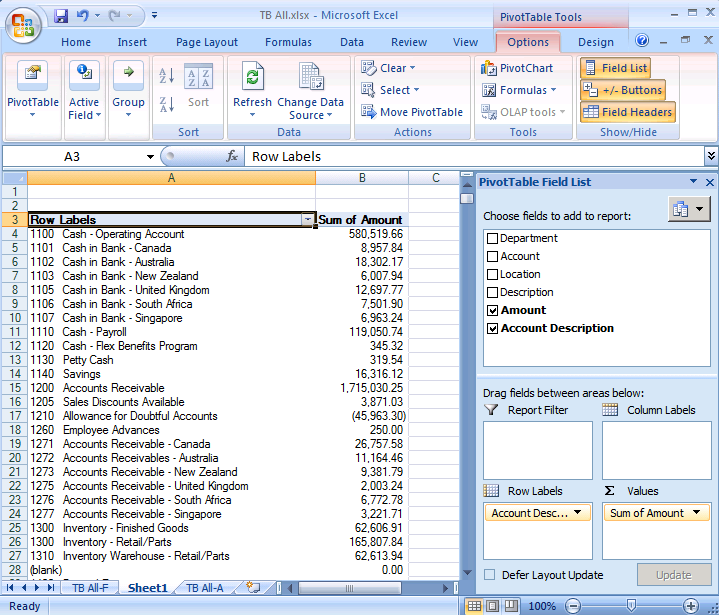
You can lose the Row Labels in cell A3 by clicking the Field Headers button at the top right if you want.
This looks great, but don’t get too excited yet.
Unfortunately the Account Description field doesn’t quite sort correctly
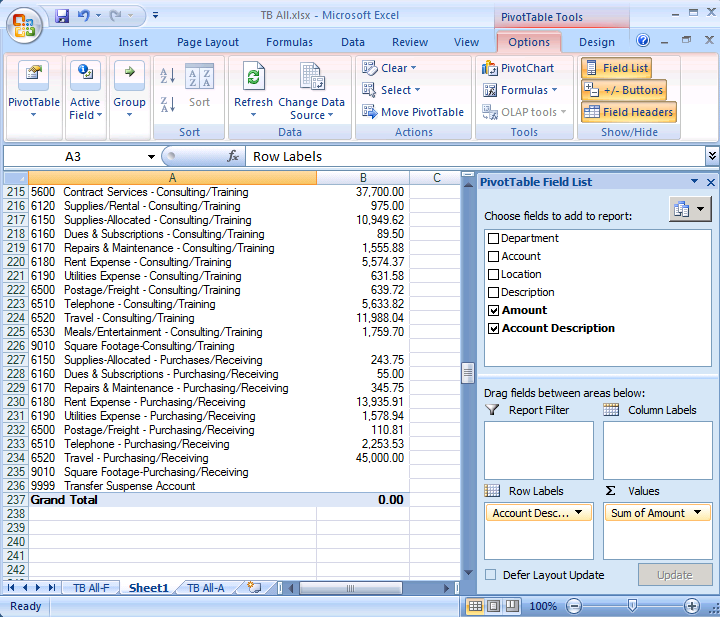
For instance, take a look at account 6180 Rent Expense. There are two of them. Here’s what to do.
Click the Account checkbox and move its tile above Account Description
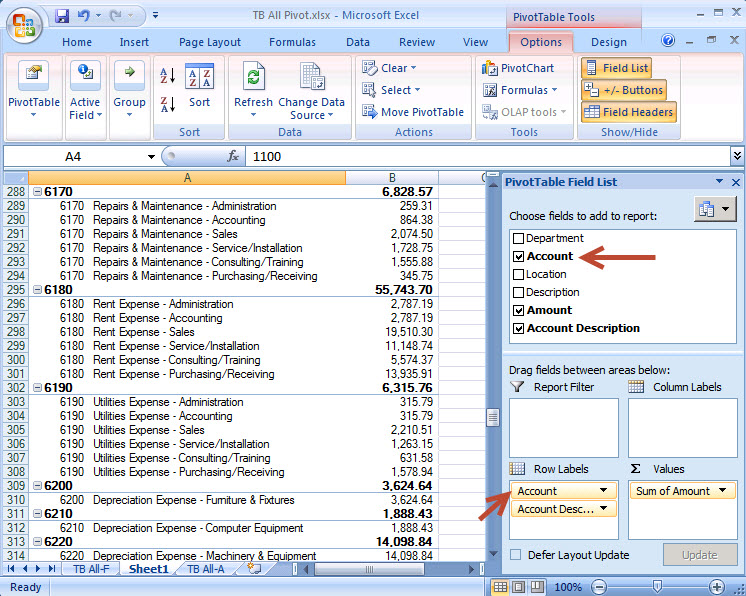
Voila. NOW it’s sorted correctly.
Now the fun begins—monkey around with the Pivot
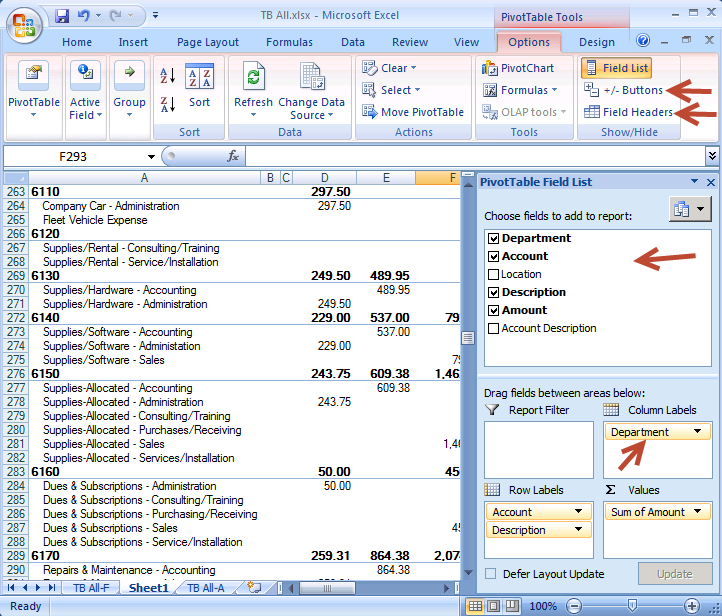
Move tiles around. For instance, put Department in the column.
Experiment. Uncheck +/- and Field Headers buttons. See what you get.
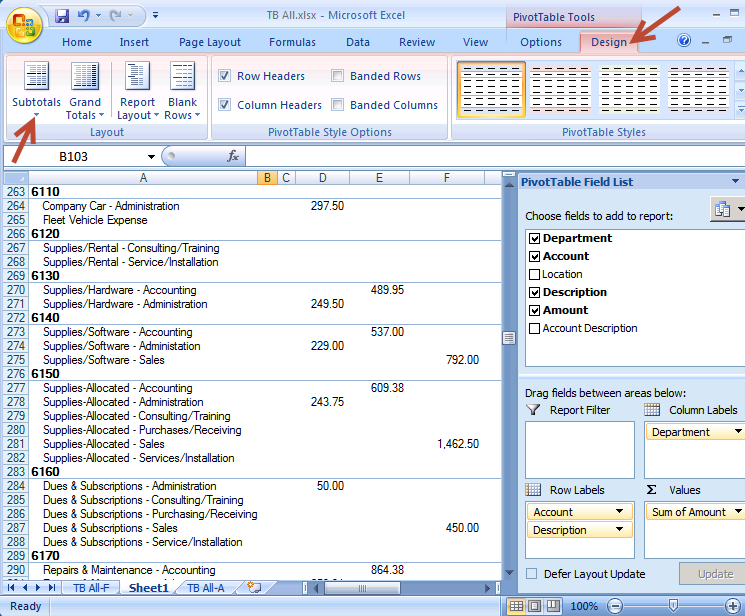
You can also turn off Subtotals on the Design tab
So much more you can do with this. I also like to fool with the Field Settings, found on the dropdown triangle on each tile—you can lose the outline and go tabular, control subtotals, and lots more. So incredibly powerful.
Honestly, though, there’s really no substitute for the look of Subtotals that could be built into Management Reporter. It was beautiful functionality in FRx—lots of oooohhhs and aaahhhhs when I taught it in class. If you’d like to ask Microsoft to add the Subtotals feature to Management Reporter, so you can do pivottable-esque things on the fly, please vote here. You won’t get 100% of the functionality of a real pivot, but it’s a truly helpful feature that’s really needed.
CHEERS! Jan
Wow…this is great. I actully learned a little more about pivot tables too :)
Very glad to hear it Geri!
Nice workaround! Having just taught the subtotal feature to a group of users at an internal conference (who were very excited to learn about it) and discussing the eventual move away from FRx (when our corporate headquarters makes a call on our future reporting solution), I was very disappointed to come home and learn that this feature is missing from MR. I was #50 in support of MR subtotals by the way.
Jan, Very good. I hope we do not have to do other workarounds for ‘lost’ functionality. The loss of ‘user-defined’ dimensions going forward is another issue. Replaced with attribute values is not ideal.
Regards, David.
Thanks Chris…excellent comment re your disappointment…and thanks for vote 50! Jan
Thanks David…right there with you!
There’s additional information about voting and the status of subtotals in this related post:
Beer and View Subtotals
Has the subtotal functionality been added to MR?
Hi Brand…no it has not. But I went straight to Microsoft for a comment: “This feature is one of our most requested items and is something we will be looking at beginning work on in the next year.” But I heard the same thing 4 years ago: in 2012, their comment on subtotals: “We have this as a scenario we are prioritizing for a future release.” Meanwhile, the M-R competitors have this nailed. Time to look around. Jan