Looking for Subtotals in MR? Me too. While we're waiting, here's how to create a pivot in Excel that's a lot more work, but a half decent substitute. Here's a visual on what Subtotals give you Currently when you drill down in Management Reporter, you get a list showing … [Read more...]
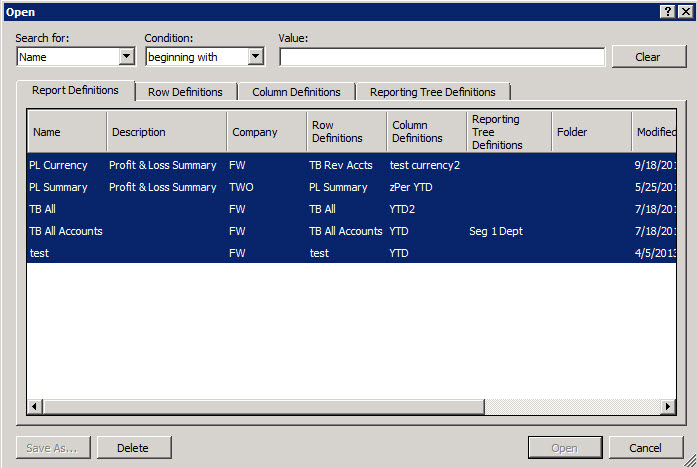
How to List Your MR Report Definitions in Excel
I got this question from my friend and fellow MR consultant recently "Is there a way in Management Reporter to print a list of report definitions or download to excel or copy/paste to excel? I could create an SRS report, but I haven’t looked at the SQL tables yet." Bottom … [Read more...]
How To Create a Pivot Table from an FRx or MR Report
A Pivot Table is an extremely powerful feature in Excel, one that is probably underutilized in many companies. It's just so cool to be able to move 'tiles' around and analyze your data a jillion different ways. Even though pivot tables can be sort of intimidating, they're not … [Read more...]
Linking to Excel to Use Period Numbers in Calculations
Earlier this week, I wrote about how to divide headcount by the period number. This post can be found at How To Divide Headcount by the Period Number. In the realm of "there's more than one way to get downtown", today I'll revisit using the period number in calculations. Today's … [Read more...]
Read This Book if Charting with Excel and FRx
Data by FRx, Charts by Excel I highly recommend Excel Charts by John Walkenbach. Excellent coverage on creating high-impact charts, in addition to warnings about what not to do. I already sort of knew charting, or at least I thought I did. But this book starts from the beginning … [Read more...]


